That's a wrap on GrafanaCON 2025!

Sign up to get notified about future events and product updates.

Catch up on all the announcements Read recap blog post –>

On-demand sessions

  • 9:00 AM
  • 60 mins
  • Main Stage

Opening keynote

Join co-chairs Carl Bergquist, Mihaela Maior, and Richard “RichiH” Hartmann for the official kickoff to GrafanaCON 2025! Members of our engineering team will make some exciting announcements around our open source projects and unveil what’s new in Grafana 12.
  • Carl Bergquist Senior Principal Software Engineer
    Grafana Labs
  • Mihaela Maior Director of Engineering
    Grafana Labs
  • Richard "RichiH" Hartmann Office of the CTO
    Grafana Labs
  • Raj Dutt CEO, Co-Founder
    Grafana Labs
  • Torkel Ödegaard CGO, Co-Founder
    Grafana Labs
  • Ryan McKinley Distinguished Engineer
    Grafana Labs
  • Mat Ryer Principal Software Engineer
    Grafana Labs
  • David Kaltschmidt Senior Director, Engineering
    Grafana Labs
  • Ted Young Developer Programs Director
    Grafana Labs
  • Andrew Stucky Senior Engineering Manager
    Grafana Labs
  • Cyril Tovena Principal Software Engineer
    Grafana Labs
  • 10:00 AM
  • 30 mins
  • Main Stage

You can do what with Grafana? Highlights from our Grafana Labs hackathons

Join us for a showcase of some of the most whimsical projects that have come out of our hackathons, including Doomfana, Super Grot, and more!
  • Bogdan Matei Staff Software Engineer
    Grafana Labs
  • Domas Lapinskas Senior Software Engineer
    Grafana Labs
  • Ivana Huckova Senior Software Engineer
    Grafana Labs
  • Sven Großmann Staff Software Engineer
    Grafana Labs
  • Gianni Baiardi Staff Product Designer
    Grafana Labs
  • 11:00 AM
  • 30 mins
  • Main Stage

Dashboards to the moon: Grafana’s role in Firefly’s Blue Ghost Mission operations

Join Jesus Charles, Blue Ghost Mission 1 Flight Director, for an inside look at Firefly's recent lunar mission, the operations team, and the role Grafana played in monitoring spacecraft systems from low Earth orbit all the way to the moon's surface.
  • Jesus Charles Blue Ghost Mission 1 Flight Director
    Firefly Aerospace
  • 11:30 AM
  • 30 mins
  • Main Stage

Loki at Dropbox: Strategies for reliable petabyte-scale logging

In this session, Infrastructure Software Engineer Chris Hodges shares hard-won lessons from scaling Grafana Loki to manage multi-petabyte unstructured logs for 1,000+ services at Dropbox.
  • Chris Hodges Infrastructure Software Engineer
    Dropbox
  • 12:00 PM
  • 30 mins
  • Main Stage

7 features to get more out of Loki with Logs Drilldown in Grafana

This session will show you how to get the most out of Loki with Logs Drilldown, the queryless, point-and-click experience in Grafana that allows you to quickly find insights in your observability data — no queries or complicated syntax required.
  • Trevor Whitney Staff Software Engineer
    Grafana Labs
  • Matias Wenceslao Chomicki Staff Engineer
    Grafana Labs
  • 1:30 PM
  • 30 mins
  • Main Stage

From Raspberry Pi to apple pie: Monitoring an off-grid family orchard

Learn how Arthur Kepler's work as a site reliability engineer helped him build a remotely managed monitoring system for an orchard using solar power, remote networking, MQTT, InfluxDB, and Grafana.
  • Arthur Kepler Principal DevOps Engineer
    Thrackle
  • 2:00 PM
  • 30 mins
  • Main Stage

Prometheus 3.0: Everything you need to know

3.0 is the first major version of Prometheus in seven years — and we're celebrating the milestone. With a brand-new user interface, and offering new features such as UTF-8 character support, this release also enabled many small improvements that were previously behind feature flags.
  • Carrie Edwards Staff Software Engineer
    Grafana Labs
  • Goutham Veeramachaneni Product Manager
    Grafana Labs
  • 2:30 PM
  • 30 mins
  • Main Stage

Mimir 3.0 preview: Major improvements to stability, performance, cost, and scalability

In this session, Mimir team members will preview the new features in the upcoming Grafana Mimir 3.0 major release.
  • David Grant Software Engineer
    Grafana Labs
  • Jonathan Halterman Principal Engineer
    Grafana Labs
  • 3:00 PM
  • 10 mins
  • Main Stage

Easier and faster exploration of complex metrics with Metrics Drilldown in Grafana

See a demo of the power of Metrics Drilldown, including its novel approach to metrics exploration, integrating OpenTelemetry resource attributes with Prometheus labels.
  • Brendan O'Handley Senior Software Engineer
    Grafana Labs
  • 3:10 PM
  • 20 mins
  • Main Stage

Golden Grot Awards ceremony

And the Golden Grot goes to…. Find out the winners of our annual Golden Grot Awards, which highlight the amazing Grafana dashboards our community creates.
  • 4:00 PM
  • 30 mins
  • Main Stage

How Grafana helps passenger satisfaction take flight at Schiphol Airport

DevOps engineer Gerard van Engelen will share how PXP leverages Grafana, Prometheus, Loki, Tempo, Alloy, and Faro to enable real-time, data-driven insights into system performance and user interactions. These insights support passenger satisfaction, streamline operations, and reveal new commercial opportunities for one of the busiest airports in the world.
  • Gerard van Engelen Platform Engineer
    Codepeople
  • 4:30 PM
  • 30 mins
  • Main Stage

Easy homelab observability with Grafana Beyla, powered by eBPF and OpenTelemetry

Learn how to deploy Beyla with Prometheus and leverage the power of OpenTelemetry’s semantic conventions to observe your services with ease, in your home lab or in production.
  • Nikola Grcevski Principal Software Engineer
    Grafana Labs
  • Goutham Veeramachaneni Product Manager
    Grafana Labs
  • 5:00 PM
  • 15 mins
  • Main Stage

Circumnavigation or bust: The OSS data stack powering a droneship’s journey around the world

Embark on an extraordinary journey with Project Bob, spacecraft engineer Andrew McCalip's plan to send a 14-foot drone boat on a record-breaking 25,000-mile circumnavigation of the globe, leveraging Grafana and Tailscale to achieve seamless connectivity and real-time data monitoring.
  • Andrew McCalip Head of Research And Development
    Varda Space Industries
  • 9:00 AM
  • 90 mins
  • Main Stage

Grafana 12 deep dive

Check out the latest major release of your favorite dashboarding tool! The engineers behind the new features and functionality for Grafana will lead a deep dive session on what's new: from dashboards as code, config in git, and dynamic dashboards to updates to alerting, the app platform, and beyond.
  • Mitch Seaman Senior Director of Product
    Grafana Labs
  • Mihaela Maior Director of Engineering
    Grafana Labs
  • Stephanie Hingtgen Principal Software Engineer
    Grafana Labs
  • Jean-Philippe Quéméner Staff Software Engineer
    Grafana Labs
  • Ryan McKinley Distinguished Engineer
    Grafana Labs
  • Bogdan Matei Staff Software Engineer
    Grafana Labs
  • Dominik Prokop Principal Engineer
    Grafana Labs
  • Thanos Karachalios Group Product Manager
    Grafana Labs
  • 11:00 AM
  • 30 mins
  • Main Stage

k6 1.0: How this long-awaited major release makes it easier to get started with testing

Grafana k6 v1.0 is here! k6 contributors will demonstrate features in the open source load testing tool, such as native extensibility (no more xk6 workarounds); the OpenAPI converter to streamline and automate the creation of TypeScript-based tests; and k6 Studio, a desktop application that simplifies performance testing for everyone.
  • Théo Crevon Staff Software Engineer
    Grafana Labs
  • Ayush Goyal Senior Software Engineer
    Grafana Labs
  • 11:30 AM
  • 30 mins
  • Main Stage

Grafana Alloy: combining the OpenTelemetry Collector with a high-performance Prometheus pipeline

Grafana Labs' Ted Young and Johanna Öjeling provide a demo of how Alloy delivers a distribution of the OpenTelemetry Collector and a high-performance Prometheus pipeline in a single binary deployment; the debugging workflows; and the performance and cost savings users have seen running it at scale.
  • Johanna Öjeling Senior Software Engineer
    Grafana Labs
  • Ted Young Developer Programs Director
    Grafana Labs
  • 12:00 PM
  • 30 mins
  • Main Stage

Without a trace (query): Troubleshooting simplified with Tempo and Traces Drilldown in Grafana

See how Traces Drilldown in Grafana, powered by Grafana Tempo, can simplify complex troubleshooting, helping you quickly detect latency issues, identify error trends, and spot anomalies – all without having to learn yet another query language.
  • Andrew Stucky Senior Engineering Manager
    Grafana Labs
  • Alex Simion Senior Software Engineer
    Glovo
  • Deepika Muthudeenathayalan Staff Software Engineer
    Glovo
  • 1:30 PM
  • 30 mins
  • Main Stage

Agent-driven Grafana: Going beyond AI chat interactions

Learn how LLMs can evolve from simple chat interfaces to become active participants in the Grafana ecosystem with new agentic workflows.
  • Yasir Ekinci Principal Engineer
    Grafana Labs
  • 2:00 PM
  • 30 mins
  • Main Stage

Deep dive into the InfluxDB 3 Core open source release

InfluxDB 3 Core is the new open source release of InfluxDB 3, a time series and analytic event database built with Apache Arrow, DataFusion, and Parquet. InfluxDB creator Paul Dix will cover InfluxDB Core's diskless design, which allows it to operate solely with object storage (in addition to a regular local disk).
  • Paul Dix Cofounder and CTO
    InfluxData
  • 2:30 PM
  • 30 mins
  • Main Stage

Why you should care about continuous profiling and how to get started with Profiles Drilldown in Grafana

Pyroscope co-founder Ryan Perry will highlight real-world examples of how continuous profiling has transformed performance engineering at Grafana Labs and beyond, and show you how to get started with the query-less Profiles Drilldown app in Grafana.
  • Ryan Perry Principal Product Manager
    Grafana Labs
  • 3:00 PM
  • 10 mins
  • Main Stage

K8s Dungeon Crawl: When observability meets adventure

Step into the K8s Dungeon Crawl, where Grafana isn't just for dashboards. In this lightning talk, Kim Schaefer will guide you through a modified version of the classic open source dungeon crawler Brogue. But in K8s Dungeon Crawl, in-game monsters are mirrored as Kubernetes deployments.
  • Kim Schaefer Cloud Native Enthusiast
  • 3:10 PM
  • 10 mins
  • Main Stage

My laundry dashboard and other absurdly unconventional use cases for Grafana

How much time is left on my laundry load? A million rows of metrics in TimescaleDB later, Dakota Roth had a real-time Grafana dashboard monitoring how busy the laundry room was, which machines were used the most – and yes, when his load of laundry would be done.
  • Dakota Roth Student
  • 3:20 PM
  • 10 mins
  • Main Stage

Hungry for data: Monitoring carnivorous plants with Grafana, Prometheus, and Loki

In this lightning talk, Jay Clifford, a developer advocate at Grafana Labs, shares his journey of applying observability practices to maintain a small carnivorous plant tank, turning his love for these fascinating plants into a data-driven passion project.
  • Jay Clifford Senior Developer Advocate
    Grafana Labs
  • 4:00 PM
  • 30 mins
  • Main Stage

Monitoring EA App’s 200+ core error metrics with a scalable, color-coded Grafana dashboard

In this session, EA Software Engineer Kenny Chen walks through how his team built a Grafana dashboard that client teams can use to monitor 200+ core error metrics.
  • Kenny Chen Software Developer II
    Electronic Arts
  • 4:30 PM
  • 10 mins
  • Main Stage

Bringing situational awareness to observability with Grafana and Prometheus

Orange Barrel Media Engineering Manager Christoph Roedig will explore how to make observability tools more helpful in real-world scenarios, such as monitoring a large network of touchscreen multimedia kiosks across the U.S.
  • Christoph Roedig Manager, Production Systems
    Orange Barrel Media
  • 4:40 PM
  • 10 mins
  • Main Stage

Radio Grafana: Mapping planes and ships using data from radio receivers

Learn how data gathered from radio receivers fetching locations of planes, ships, and Meshtastic devices can be used to create reception overviews using Grafana, Prometheus, a bit of custom code, and a home server.
  • Mateusz Kulewicz Software Engineer
    Canonical
  • 4:50 PM
  • 30 mins
  • Main Stage

Air-gapped observability at the edge: Monitoring distributed infrastructures with Grafana

Senior Site Reliability Engineer Ruslan Dautov explores how ZEDEDA integrates Grafana, Loki, and Prometheus to deliver real-time observability for large-scale distributed, air-gapped, and intermittently connected edge infrastructures. You'll see how industries like manufacturing and energy leverage Grafana to monitor edge infrastructure under strict network constraints.
  • Ruslan Dautov Senior Site Reliability Engineer
    ZEDEDA
  • 5:20 PM
  • 10 mins
  • Main Stage

3 data source plugins to add to your stack after this talk

Learn about three data source plugins that can enrich your existing dashboards in new ways.
  • Sarah Zinger Staff Software Engineer
    Grafana Labs
  • 5:30 PM
  • 10 mins
  • Main Stage

Advancing security and innovation: Microsoft’s open source contributions to Grafana

Microsoft Software Engineer John Naizer will walk through his team's migration to Grafana for executive dashboards to track metrics, manage incidents, maintain service quality, and more. The team also built a new authentication system that offered greater security than the existing native Azure authentication in Grafana and contributed the feature to Grafana OSS
  • John Naizer Software Engineer
    Microsoft
  • 5:40 PM
  • 15 mins
  • Main Stage

Closing talk

That's a wrap on GrafanaCON 2025!
  • Tom Wilkie Chief Technology Officer
    Grafana Labs

What’s happening at GrafanaCON 2025

News

Hear about the latest Grafana features and visualizations and other developments in the extended open source monitoring ecosystem.

Community

Get inspired by community members who are dashboarding everything and using Grafana in cool and surprising ways.

Education

Learn from 20+ talks, deep dives, and hands-on sessions covering Grafana, Prometheus, OpenTelemetry, Loki, Mimir, Tempo, and more.

Hallway track

Meet your Community Forum friends and LinkedIn connections in person. Share ideas, tips and tricks, and your favorite dashboards!

When

May 6-8, 2025

Where

McCaw Hall at Seattle Center
321 Mercer Street
Seattle, WA 98109

Hands-on labs
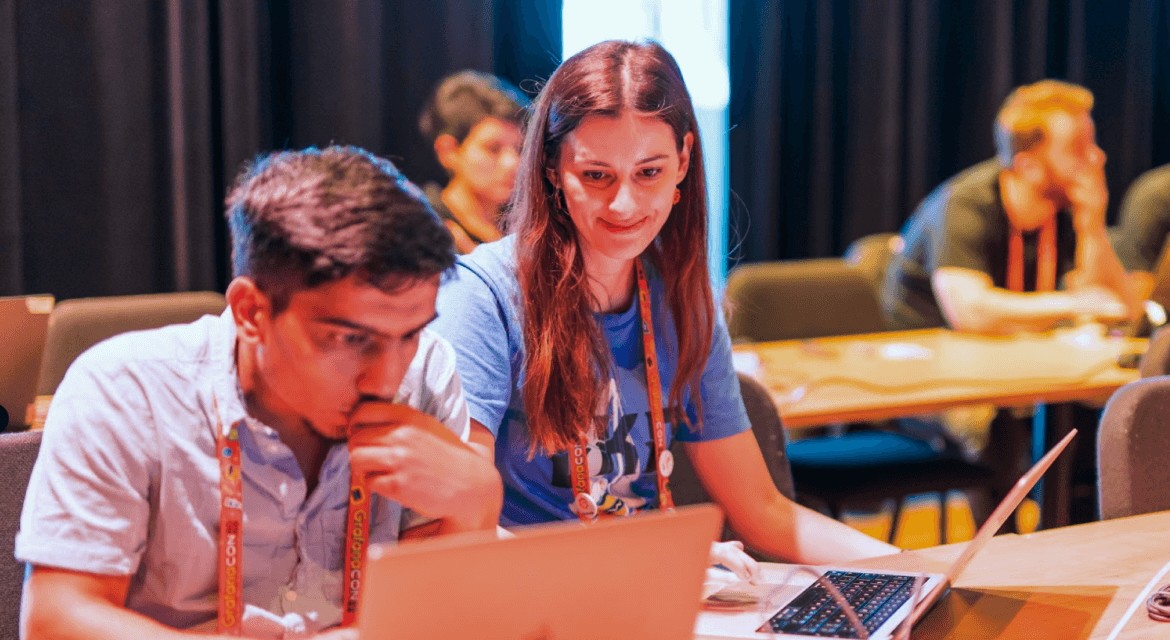
Get firsthand experience in building dashboards, data sources, new telemetry pipelines, and more. Grafana Labs experts will lead hands-on labs in a variety of topics and teach you tips and tricks to improve your skills.
Learn more about the labs
Photo of engineers at 2024 GrafanaCON workshop
Winning Grafana dashboard for Golden Grots

Golden Grot Awards

Each year, we recognize our open source community and the amazing Grafana dashboards that they create with the annual Golden Grot Awards. Find out more about how to enter, how to vote, and the Golden Grot Award winners.
Learn about the Golden Grots

GrafanaCON Local

Couldn’t make it to Seattle? Lucky for you, we’re taking our biggest community event on a world tour. GrafanaCON Local will be a half-day event hosted in Singapore, Berlin, Toronto, and Bangalore.
Learn more about GrafanaCON Local
Graphic illustration for GrafanaCON Locals 2025

Who’s ready for GrafanaCON 2026?

Sign up to learn more about next year’s conference and other related events.

Thank you to our sponsors

Pioneer

Guru

Champion

Community Star

Sponsor a Grafana Labs event

Interested in sponsorship opportunities at Grafana Labs events? Email sponsors@grafana.com to learn more.
No need to wait to meet and mingle

No need to wait to meet and mingle

Stop by and say hi in the #grafanacon channel in Grafana Labs’ Community Slack.
Join the conversation ➞
Explore all the latest releases

Explore all the latest releases